If you manage a company or are frequently asked to analyze numbers, you know there are many aspects to the same number. The reason for an increase in sales is not always clear and your company doesn’t have only one dimension.
As you know, the ERP gathers all the departments of your company and this is why its data is so relevant for you. That way, when the time comes to analyze your revenue and understand all the information that goes through your ERP, it is absolutely necessary to have great tools to get the best out of your observations.
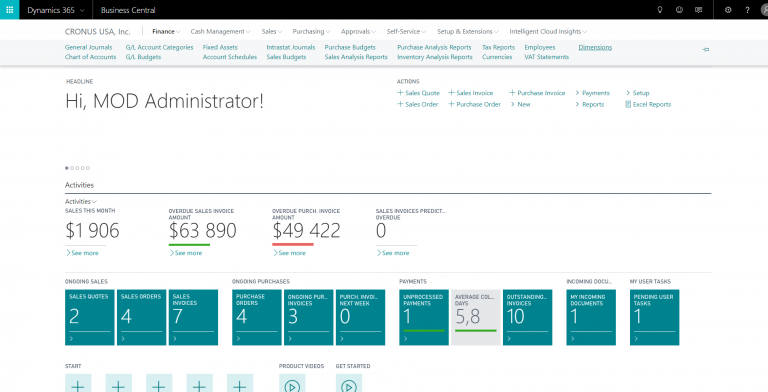
Obviously, Microsoft Dynamics Business Central has thought about that, and this is why it offers you dimensions. What are dimensions? They are, in fact, axis you can analyze your data with. You want to learn all about the dimensions in Microsoft Dynamics Business Central? Just continue to read.
What are dimensions? And how are they useful?
Dimensions are a great organization tool available in Microsoft Dynamics Business Central which make it easy to organize and analyze data.
Say your company starts selling a new product, like chocolate, all different kinds, to clients all around the world. You are going to want to keep track of which clients buy which types of chocolate and in what quantity.
This is a type of business intelligence problem, you’ll need to slice, dice, and analyze data. In this article, I’ll be showing you how to do exactly that in Microsoft Dynamics Business Central.
Dimensions and Dimensions Values in Microsoft Dynamics Business Central
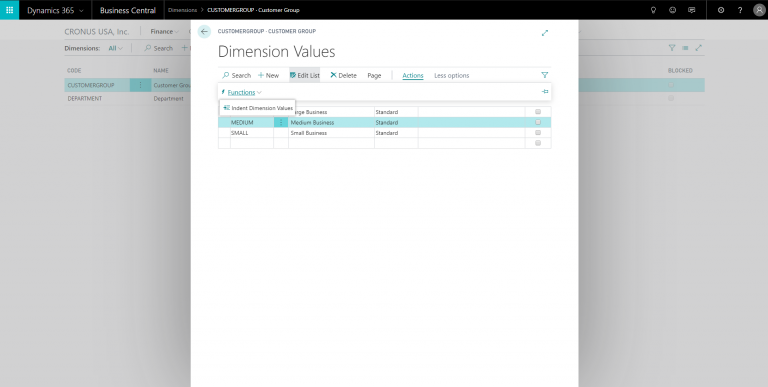
Dimensions are categories you can use for organization. You can further organize the data inside each dimension by adding values. Think of these values like tags or subcategories.
Example of Dimensions and Dimension Values:
- Dimension 1
- Dimension value A
- A.1
- A.2
- Dimension value B
- Dimension value C
- C.1
- C.2
- C.3
- Dimension 2
- Dimension value D
- Dimension value E
- Dimension value F
If we name our Dimensions and Dimensions Values, it would look more like this.
Product regions
- Canada
- Ontario
- Québec
- Royaume-Uni
- Écosse
- Irlande du nord
- Angleterre
Chocolate types
- Milk Chocolate
- Semi-sweet Chocolate
- Dark Chocolate
How to Create a New Dimension in Microsoft Dynamics Business Central
Creating new Dimensions and Dimension Values in Microsoft Dynamics Business Central is fairly simple.
It is important to note that you can create any Dimension you want, name it whatever you want, and add any values to it that you want. It is 100% customizable for your business.
Steps:
After opening Microsoft Dynamics Business Central go into Dimensions and just click “New” to create a new Dimension in Microsoft Dynamics Business Central. For the example above, you could title your Dimensions “Chocolate Region” and “Chocolate Types.” Under “Code,” the name of your dimension will appear as one word. Make sure to correct this under “Name,” “Codes Caption,” and “Filter Caption” for accuracy and consistency throughout Microsoft Dynamics Business Central.
To create a new Analysis View, click “New” and input the information pertaining to the data you would like to analyze. You can select several different filters and up to four Dimensions per Analysis View Card. We will cover that in more detail later. For now, let’s look at how to view the data from the Dimensions of our Chocolate in three easy steps!
- Go into Edit Analysis Views and next to “Show as Lines” select “CHOCOLATEREGIONS” to show them as lines.
- Next to Columns, you can change what you want to see as columns, for example “Period” will organize the columns by time frames.
- Fill in the date range or whatever data you would like to organize your data by and then select “Show Matrix” in order to view the analysis of the data.
Now you’ll be able to see the data you have organized with the Dimensions you have created. This will make it easier for you to access and share the data if necessary.

To do this, simply click on Dimension Values at the top of the window and add in your values by clicking “New.”
The “Code” is one of the organization fields for your values and is going to be an alpha-numeric field. It is probably best to use numerals here.
Here you can use Begin- and End-Totals to group your Dimensions in Microsoft Dynamics Business Central.
For our Example, in the “Chocolate Regions” Dimension, “Canada” would be the first value and it would be the Begin-Total, after Quebec add another value titled “Canada Total” and this will be the End-Total. The Begin- and End-Totals are not selectable, but the values in between are.
Using Begin- and End-Totals will allow you to easily see the totals for each group, not just the individual Dimension Values.
Assigning Dimensions
Once you have your Dimensions and your Dimension Values created, you can start assigning accounts to these Dimensions and Values.
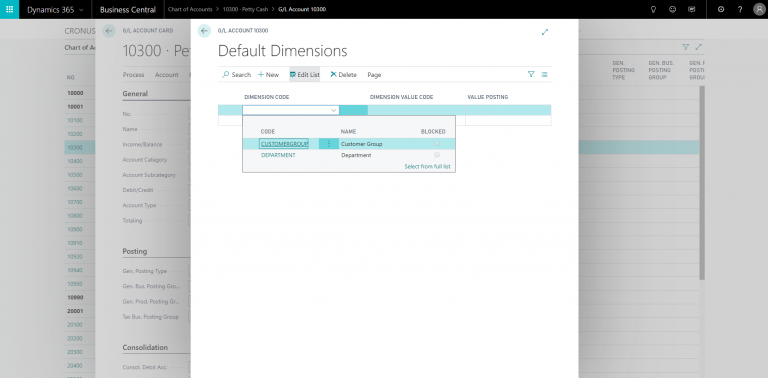
Go into the General Ledger Setup and scroll down to the Dimensions tab. Here you can select the Global and Shortcut Dimensions.
You can only select two Global Dimensions per account. These are located in the same database as your master records and are the most important Microsoft Dynamics Business Central Dimensions. These Dimensions can be used as a filter on General Ledger entries and as a filter on all Batch Jobs, Reports, and Account Schedules.
To select the Global Dimensions, go to “Actions” at the top of the window and the options will be available. For our example it would be important to select “CHOCOLATEREGIONS” or CHOCOLATETYPES” for one of the Global Dimensions.
Shortcut Dimensions help with inventory, financial, and production analyses. These can be assigned to master data or to directly to sales, purchase lines, or journals. The number of Shortcut Dimensions you can create is unlimited, but the in certain areas of Microsoft Dynamics Business Central, you can only select a limited number of them at the same time (Such as in Analysis View where you can only select four at once).
The applicable Shortcut Dimensions would be the type of chocolate and or the region.
How to Analyze by Dimensions
In Microsoft Dynamics Business Central there is something called Analysis by Dimensions.
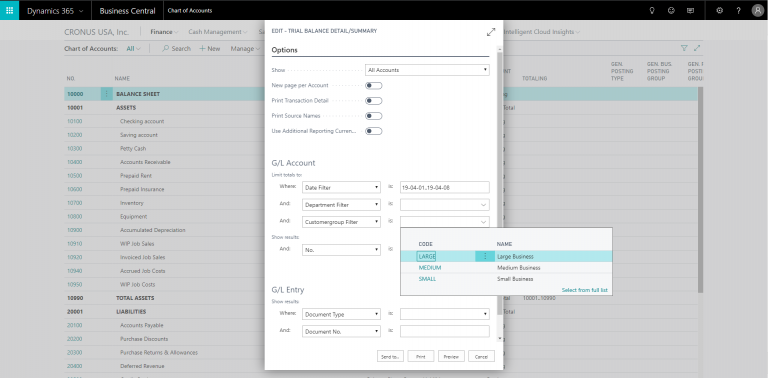
The purpose of Analysis by Dimensions is to take a look at the data which is now organized by your Dimensions.
To create a new Analysis View, click “New” and input the information pertaining to the data you would like to analyze. You can select several different filters and up to four Dimensions per Analysis View Card. We will cover that in more detail later. For now, let’s look at how to view the data from the Dimensions of our Chocolate in three easy steps!
- Go into Edit Analysis Views and next to “Show as Lines” select “CHOCOLATEREGIONS” to show them as lines.
- Next to Columns, you can change what you want to see as columns, for example “Period” will organize the columns by time frames.
- Fill in the date range or whatever data you would like to organize your data by and then select “Show Matrix” in order to view the analysis of the data.
Now you’ll be able to see the data you have organized with the Dimensions you have created. This will make it easier for you to access and share the data if necessary.
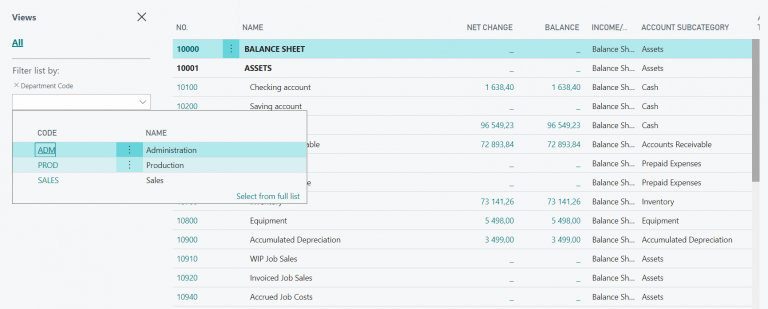
Dimensions Are Flexible in Microsoft Dynamics Business Central
Your Dimensions in Microsoft Dynamics Business Central are 100% customizable for every company and client. You get to choose how many Shortcut Dimensions you have, what they should be, and which Dimensions to assign as Global Dimensions. You can add more of each of these, but it does take a considerable amount of time to create new Global Dimensions depending on the size of your database.
Well, there you have it. Like in your company, your data has many dimensions and this is why it is so crucial to use it well. So, you can benefit from all the analytical power of Microsoft Dynamics Business Central.
Liked what you just read? Sharing is caring.

November 24, 2019 by Frédéric Charest by Frédéric Charest VP of Marketing
Data-driven Growth Marketer with a Passion for SEO - Driving Results through Analytics and Optimization


